SATYA SAI SANJANA
Welcome to my portfolio, where I showcase my skills and experience in the world of data analysis.
ABOUT ME
Thank you for visiting my data portfolio.
Hey there! I'm on a mission to master the art of being a top-notch Data Analyst . Yep, I've got a bachelor of science in MPC , but guess what? I've discovered my true passion lies in unraveling the stories hidden within data.
I am skilled in SQL , Python, Power BI, Statistics, Advanced Excel enabling me to manipulate and analyze data for efficient reporting. I've put my talents to work on real business projects, and you can check them out in my portfolio. From numbers to insights, I've got it covered.Join me as I turn raw data into game-changing decisions. Let's dive into this data-filled adventure together!

DATA ANALYSIS
sql project
Case Study: Car Retailer Analysis
DATA VISUALATION
power bi dashboard
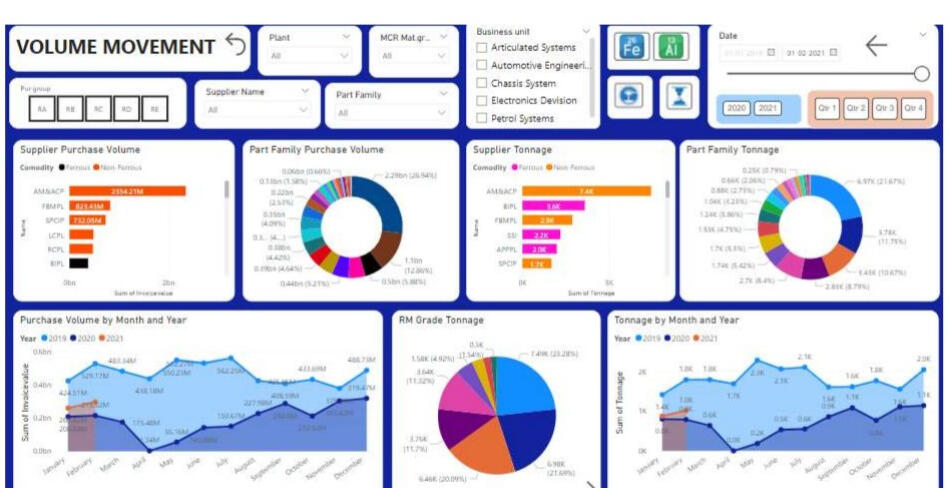
Volume Movement Dashboard -This dashboard gives a picture of all the details of year-wise volume , top-item purchased,top supplier and monthly sales trends
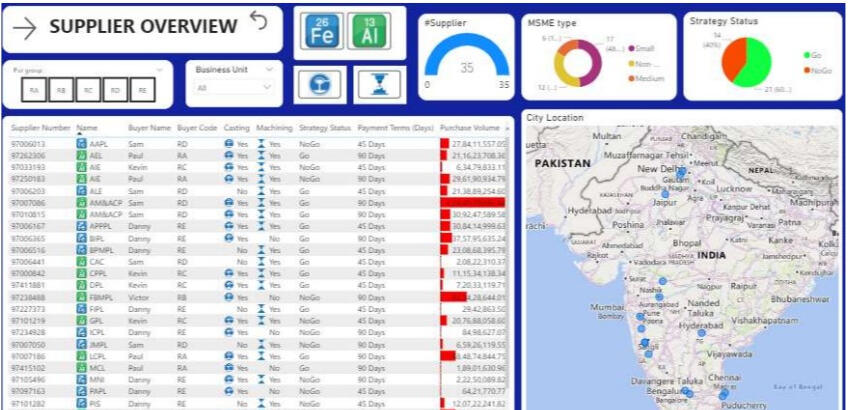
Supplier Overview Dashboard - Focuses on supplier-related information, including their location, business growth strategy, MSME classification, payment terms, and capabilities such as casting and machining.
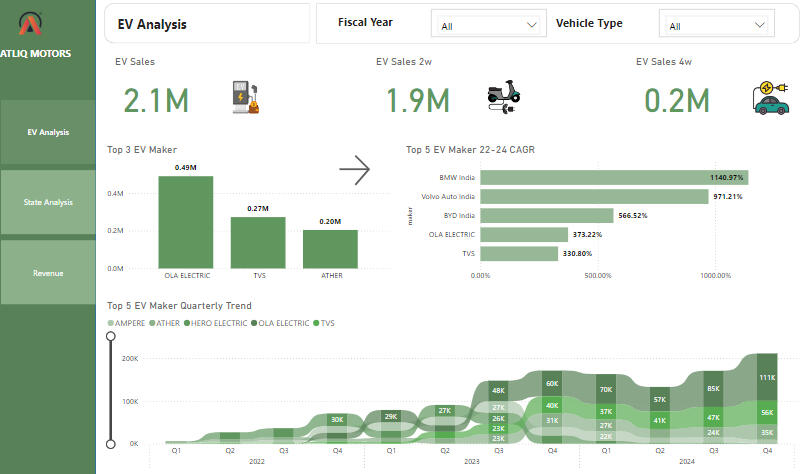
In this project, I analyzed electric vehicle sales data across various states in India to project future sales trends. Using historical data and calculating the Compound Annual Growth Rate (CAGR), I predicted EV sales for the top 10 states by penetration rate for the year 2030. I developed interactive dashboards in Power BI to visualize trends, aiding in strategic decision-making for AtliQ Motors' market expansion in India. The analysis provided actionable insights into high-potential regions, supporting the company's growth strategy in the Indian EV market.
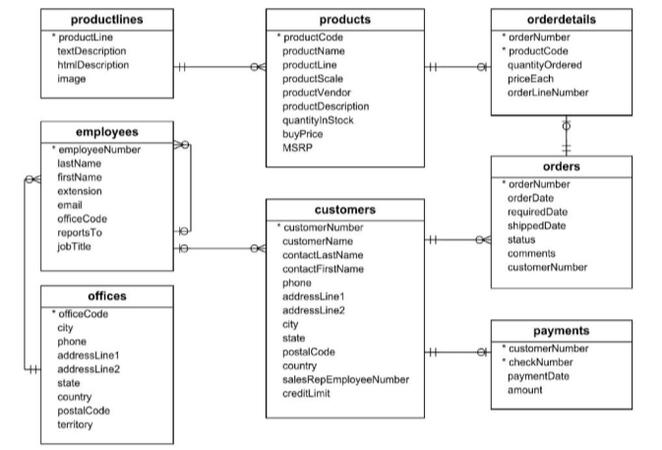
overview : This project is related to car retailer analysis, which includes scale models of classic cars.We have to work on some of the pain points of the retailer team like sales,payments,etc.. as well as help them work on doing market basket analsysis.Business Problem Statement:
Section 1: Getting the overview of the data.Section 2: Understanding the productline.Section 3: Understanding company growth and products.
Marketing team is interested in understanding the growth and decline pattern of the company in terms of new leads or sales amount by the products.Section 4: Market basket analysis.
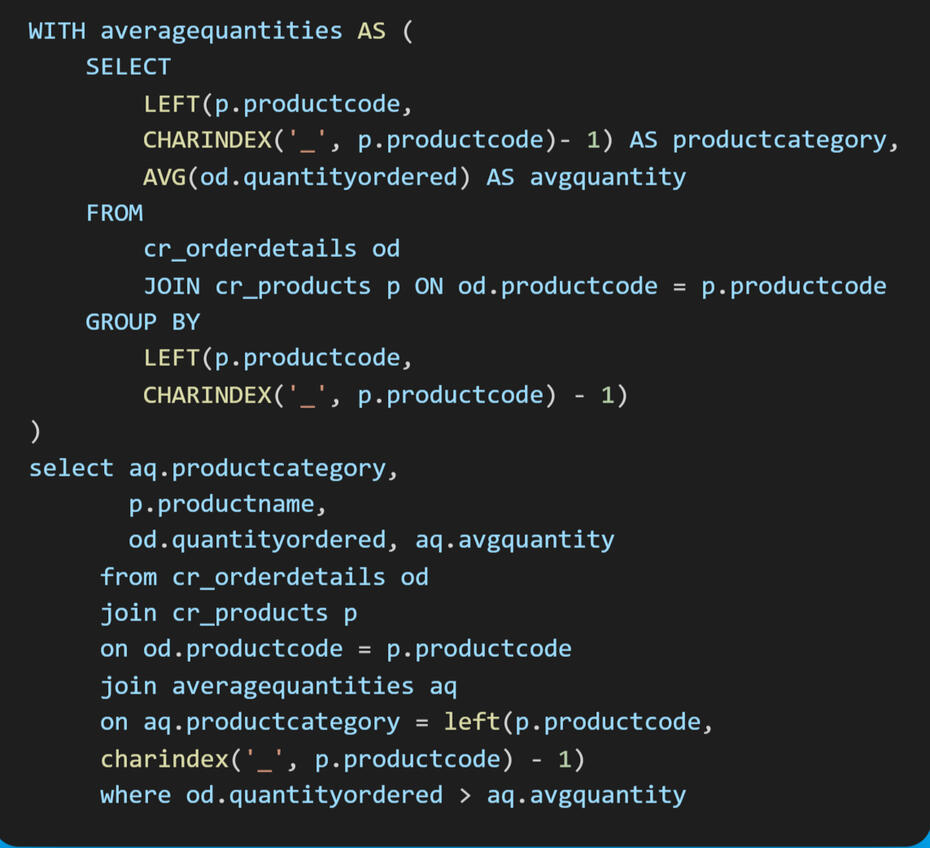
A market basket analysis is defined as a customer’s overall buying pattern of different sets of products. Essentially, the marketing team wants to understand customer purchasing patterns. Their proposal is if they promote the products in their next campaign, which are bought a couple of times together, then this will increase the revenue for the company.
After creating tables and loaded .csv file by using "SQL Server Import" (extension in Azure Data Studio). Here are the simple queries to explore month on month growth insights.
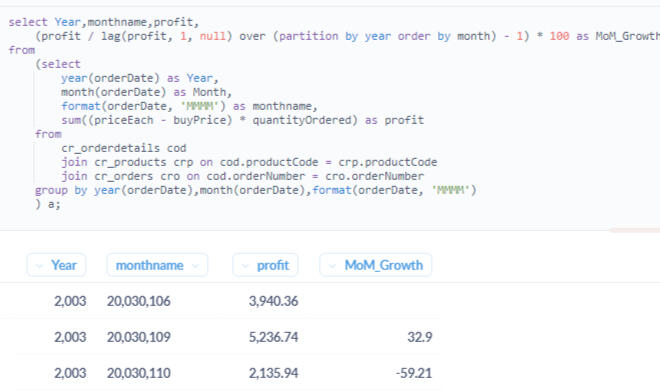
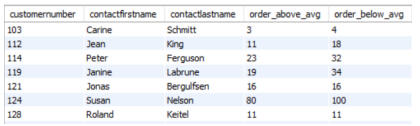
Based on the above results, we can see that the overall growth has declined in the past 1 year compared to recent years. It's very apparent from total sales as well as customers acquired.Identifying the number of each customers count the number of orders above and below the average order value.
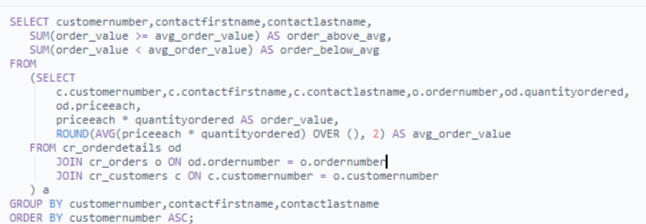
AOV = Total Revenu/Number of OrdersOrder Above AVG = Actual Order Value >= AVG Order Value
Order Below AVG = Actual Order Value < AVG Order ValueBased on the resut we find the Average Order Value , here have a look